Visualizing Small-Molecule Density in Crystal Structures with ChimeraX
·(edited)· / , , , · reads0
AI TranslationSimplified ChineseEnglish
Key Insights
This article outlines how to display crystal-structure electron density using ChimeraX and Clipper: install Clipper, open a PDB file and import its corresponding MTZ file, select a small molecule, and show the density around it before adjusting the contour level, colors, and lighting. It explains that Coot typically expresses the Contour Level in standard deviations, whereas ChimeraX defaults to absolute electron-density values. Use sdLevel to specify the level in standard deviations or rmsLevel to specify it in root-mean-square deviation units. The tutorial uses 7VH8 as an example and aims to supplement the limited guidance available on visualizing crystal-structure density.
Intro
You will need:
ChimeraX installed
A PDB file containing the crystal structure coordinates
An MTZ file with the electron density corresponding to the PDB file
This post uses 7VH8 as an example. Follow this article to get the PDB and MTZ files.
TL;DR
Open ChimeraX and install Clipper. There are two ways to install it:
In the GUI, go to Tools -> More Tools... and install it from there.
Run the command toolshed install clipper.
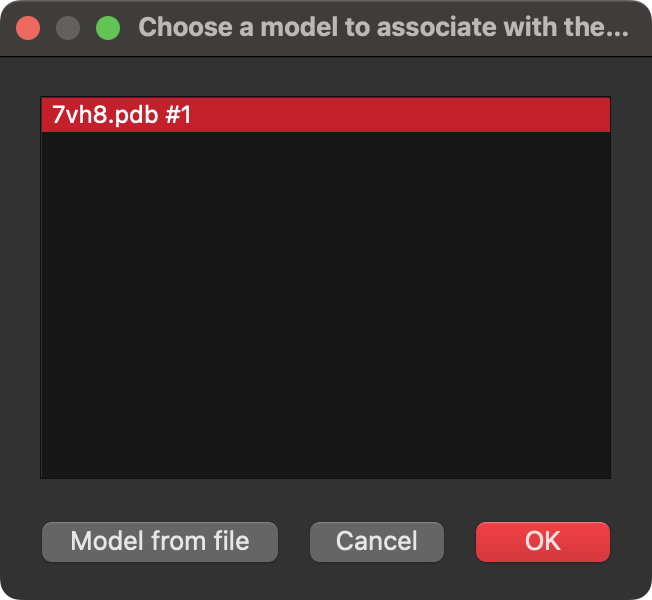
After opening the PDB file, drag the MTZ file into the window. A dialog will pop up; select the corresponding PDB.
Select the corresponding PDB file
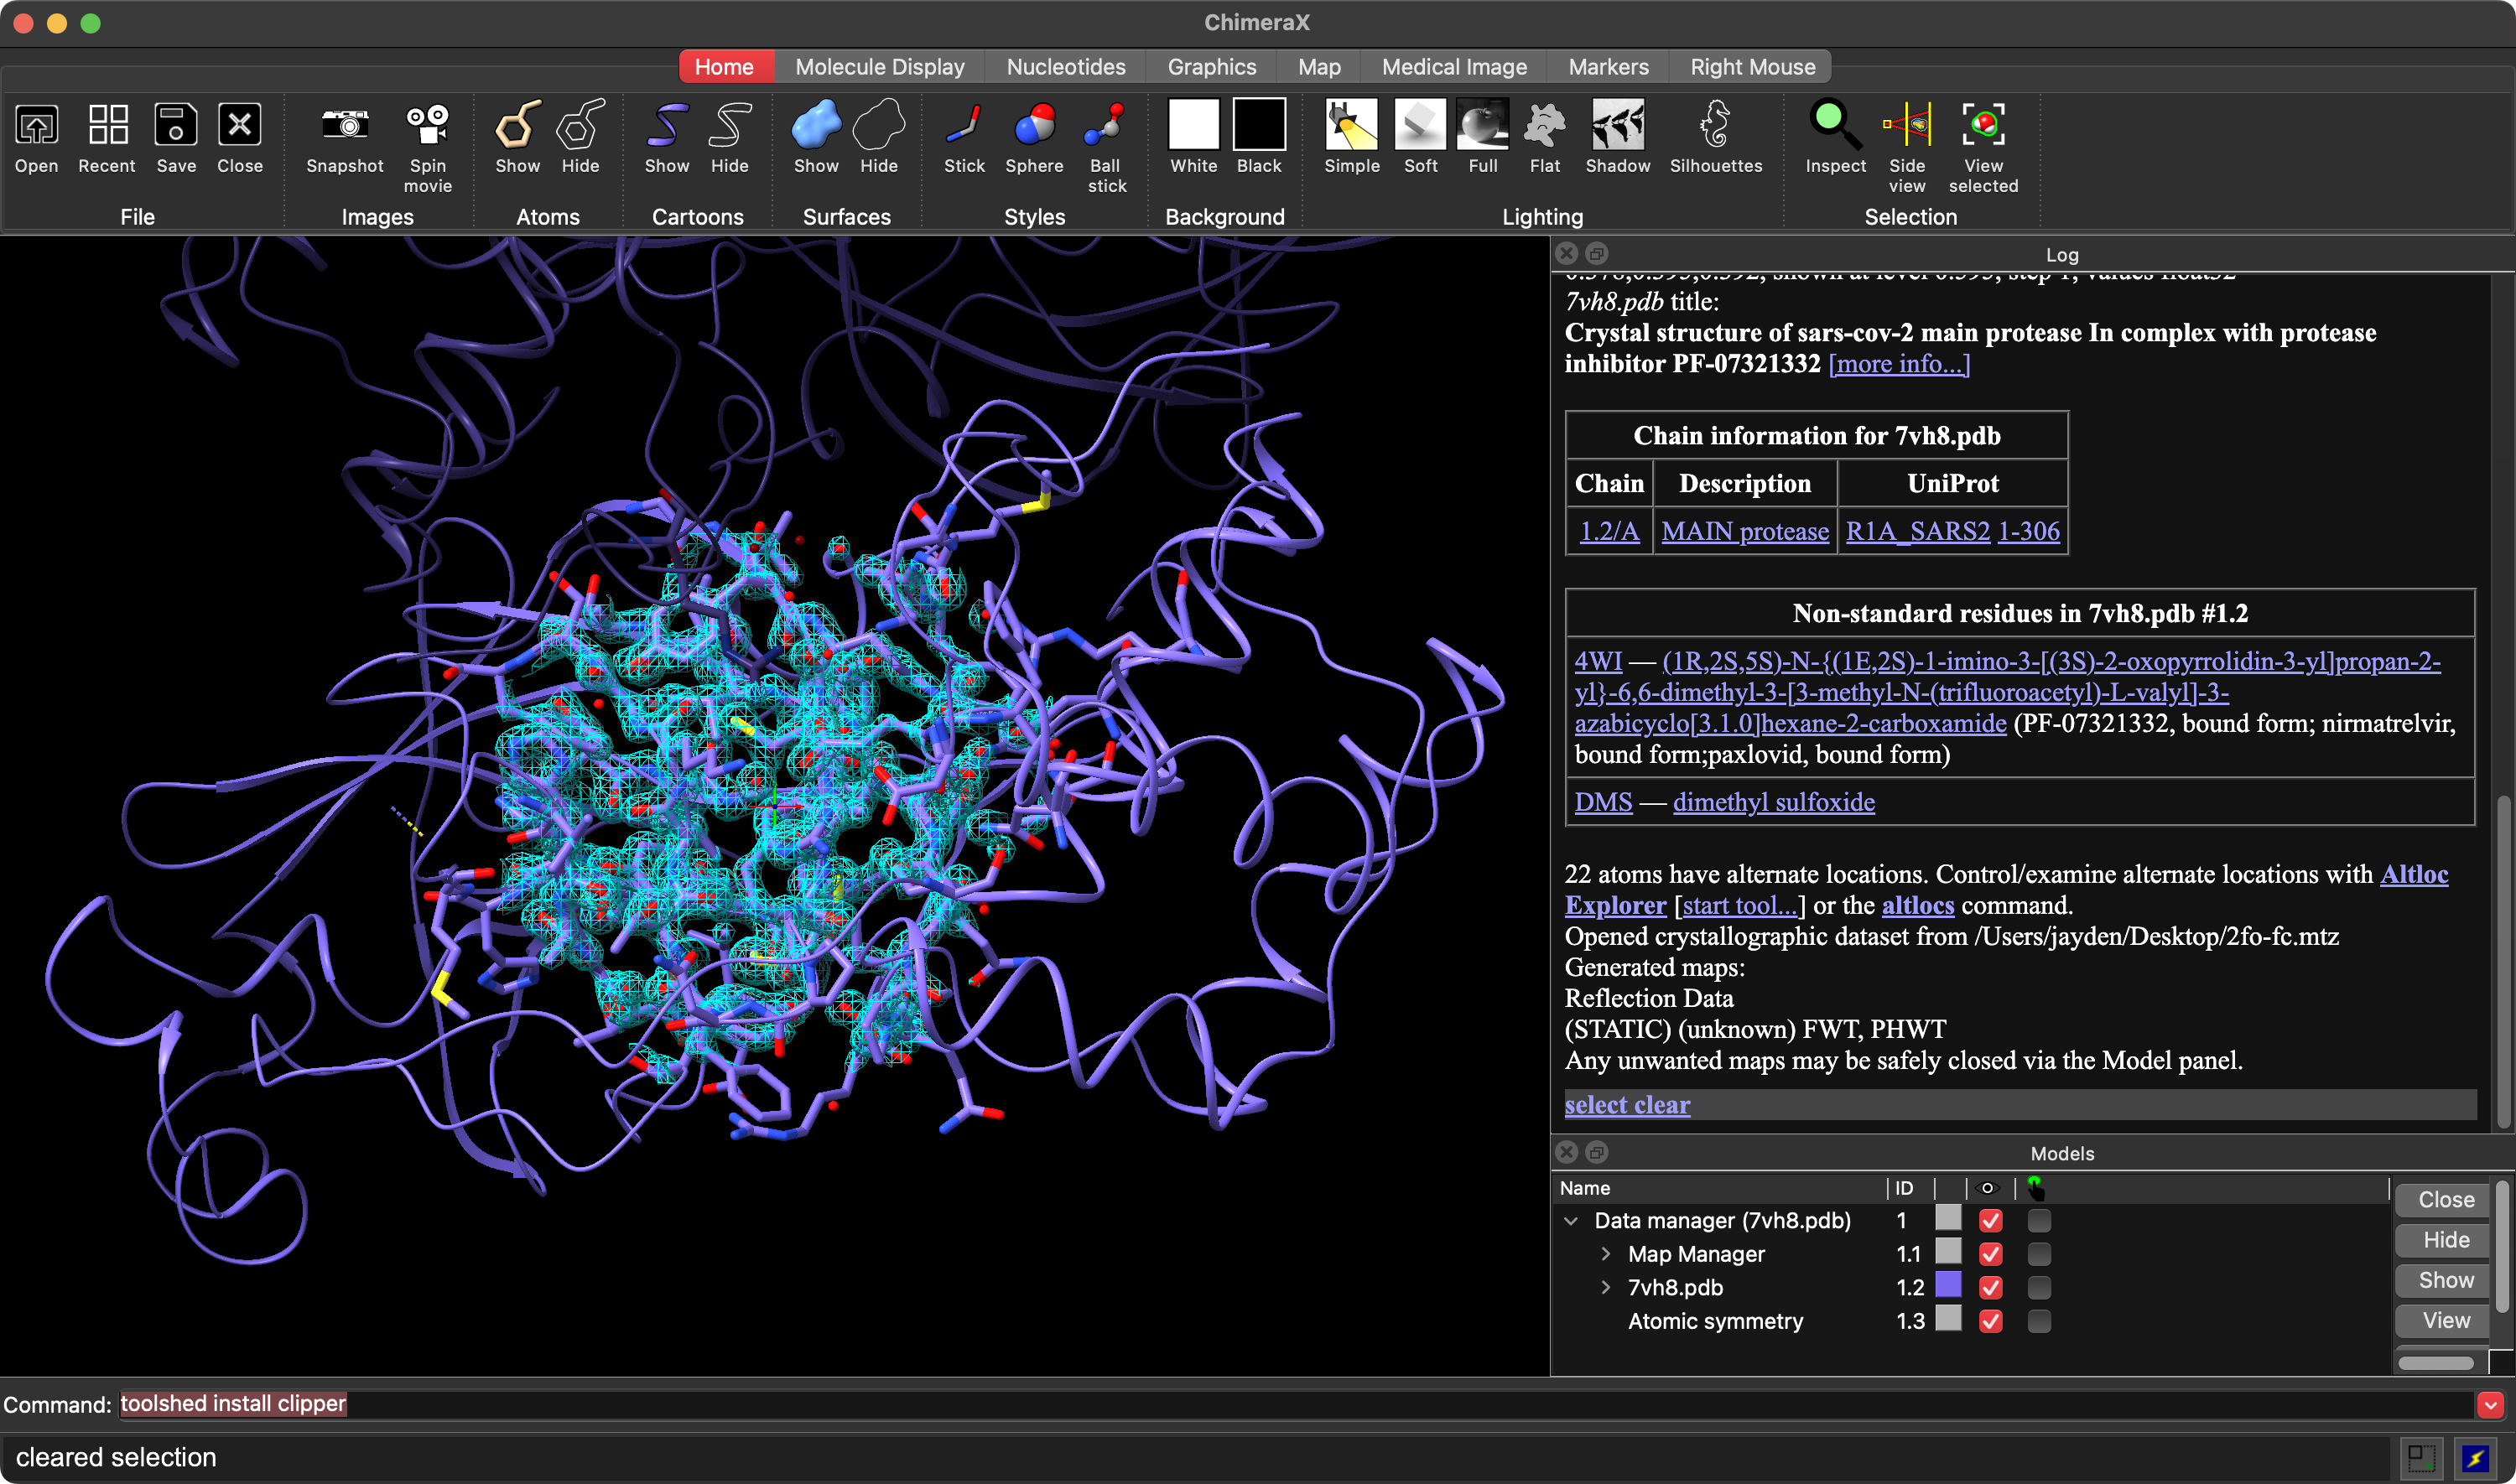
Once opened, it should look like this:
Import PDB and MTZ files
Display the density:
First, let's change the background color to white:
CHIMERAX
set bgcolor white
Then select the small molecule:
CHIMERAX
sel #1.2:4WI
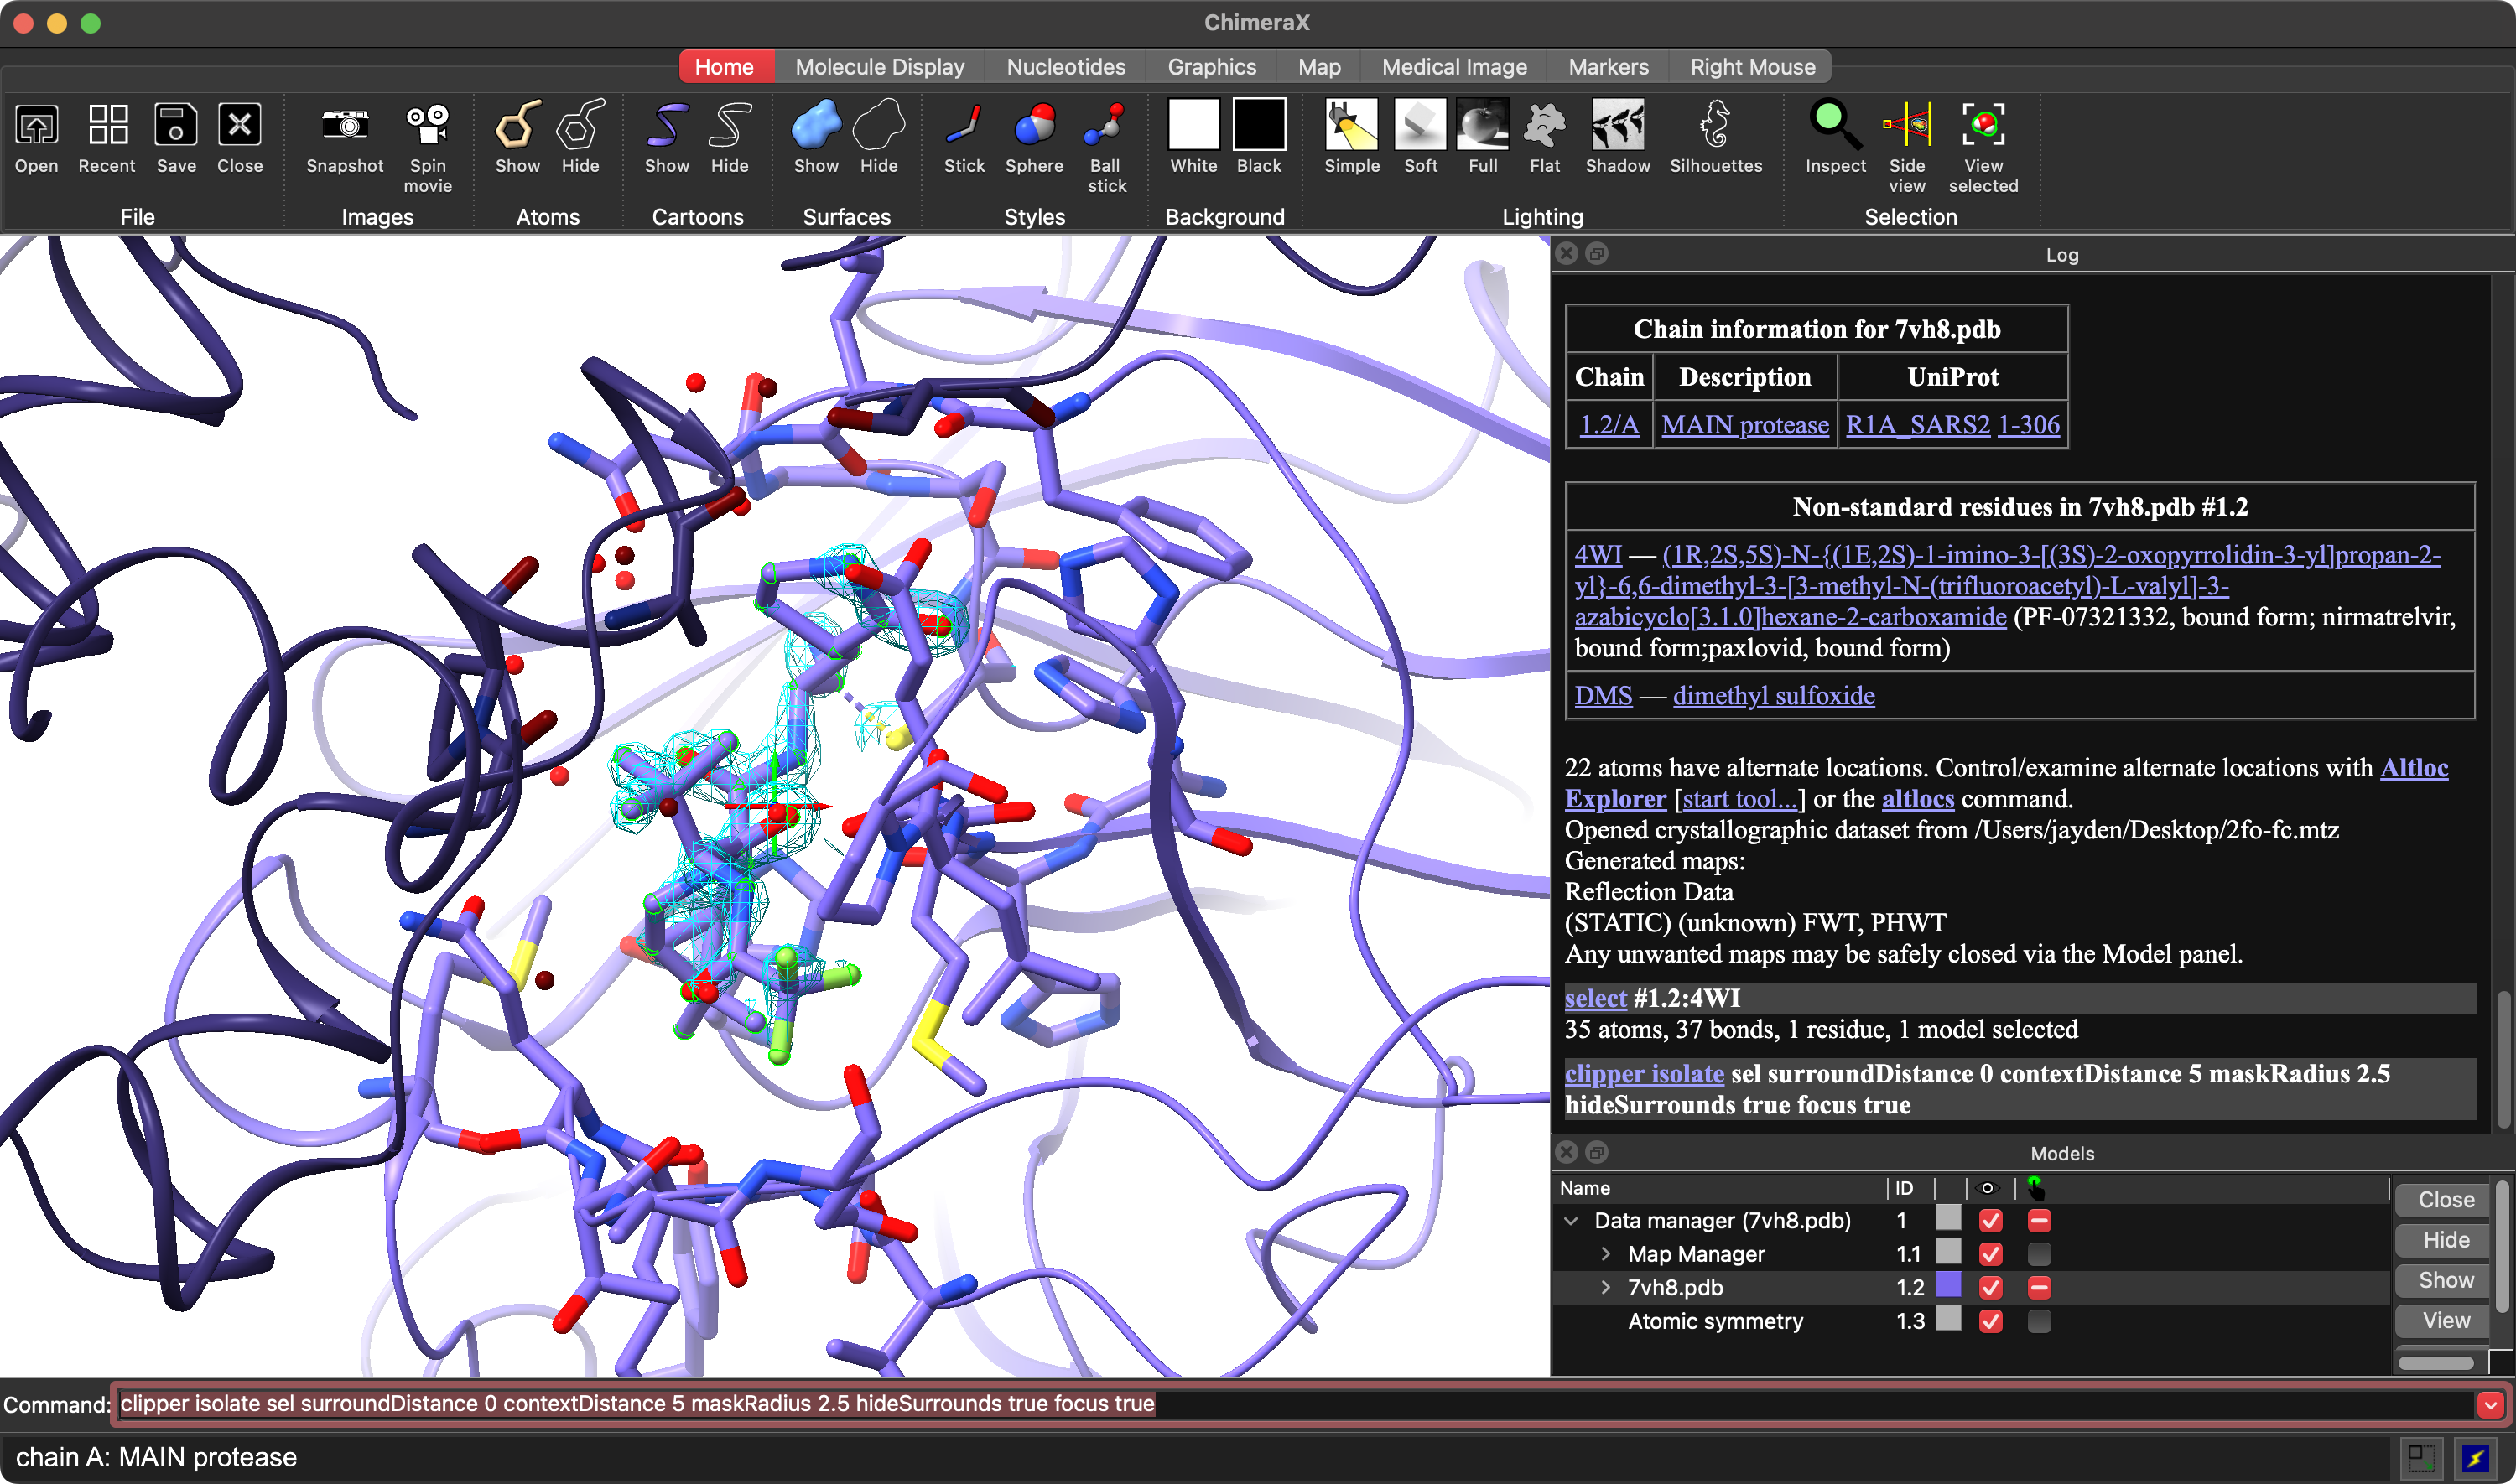
Display only the density around the small molecule:
Refers to the currently selected atoms (i.e., the small molecule)
surroundDistance
Specifies how far to extend the selection; the default is 0 Å. This parameter determines which atoms, in addition to the selected ones, are included when computing the region covered by the map.
contextDistance
Sets the distance of the additional context region to display; the default is 5 Å. These atoms are shown but not covered by the map.
maskRadius
Specifies the radius of the map mask; the default is 3 Å. This determines how far the map extends around the selected region.
hideSurrounds
If true, atoms outside the surroundDistance range are hidden (cartoon display is not affected)
focus
If true, the view resets and centers on the covered region
Display the density around the small molecule
Adjust the contour level and assign a color:
Note that Coot and ChimeraX use different conventions for the contour level:
Software
Contour Level
Coot
By default, contour levels are expressed in standard deviation (sigma) units (although the software displays them as RMSD). When the contour level is set to 1.0 in Coot, it actually means that regions with density values greater than or equal to the mean density plus 1.0 standard deviation are displayed.
ChimeraX
The contour level is usually expressed as an absolute electron density value (electron/ų). When you run the command volume #1 level 1.0, it displays regions with density values equal to or greater than 1.0 electron/ų.
Therefore:
If you want to set the contour level in standard deviation units in ChimeraX, use sdLevel, which is the same concept as in Coot.
If you want to set the contour level in root-mean-square deviation (RMSD) units in ChimeraX, use rmsLevel.
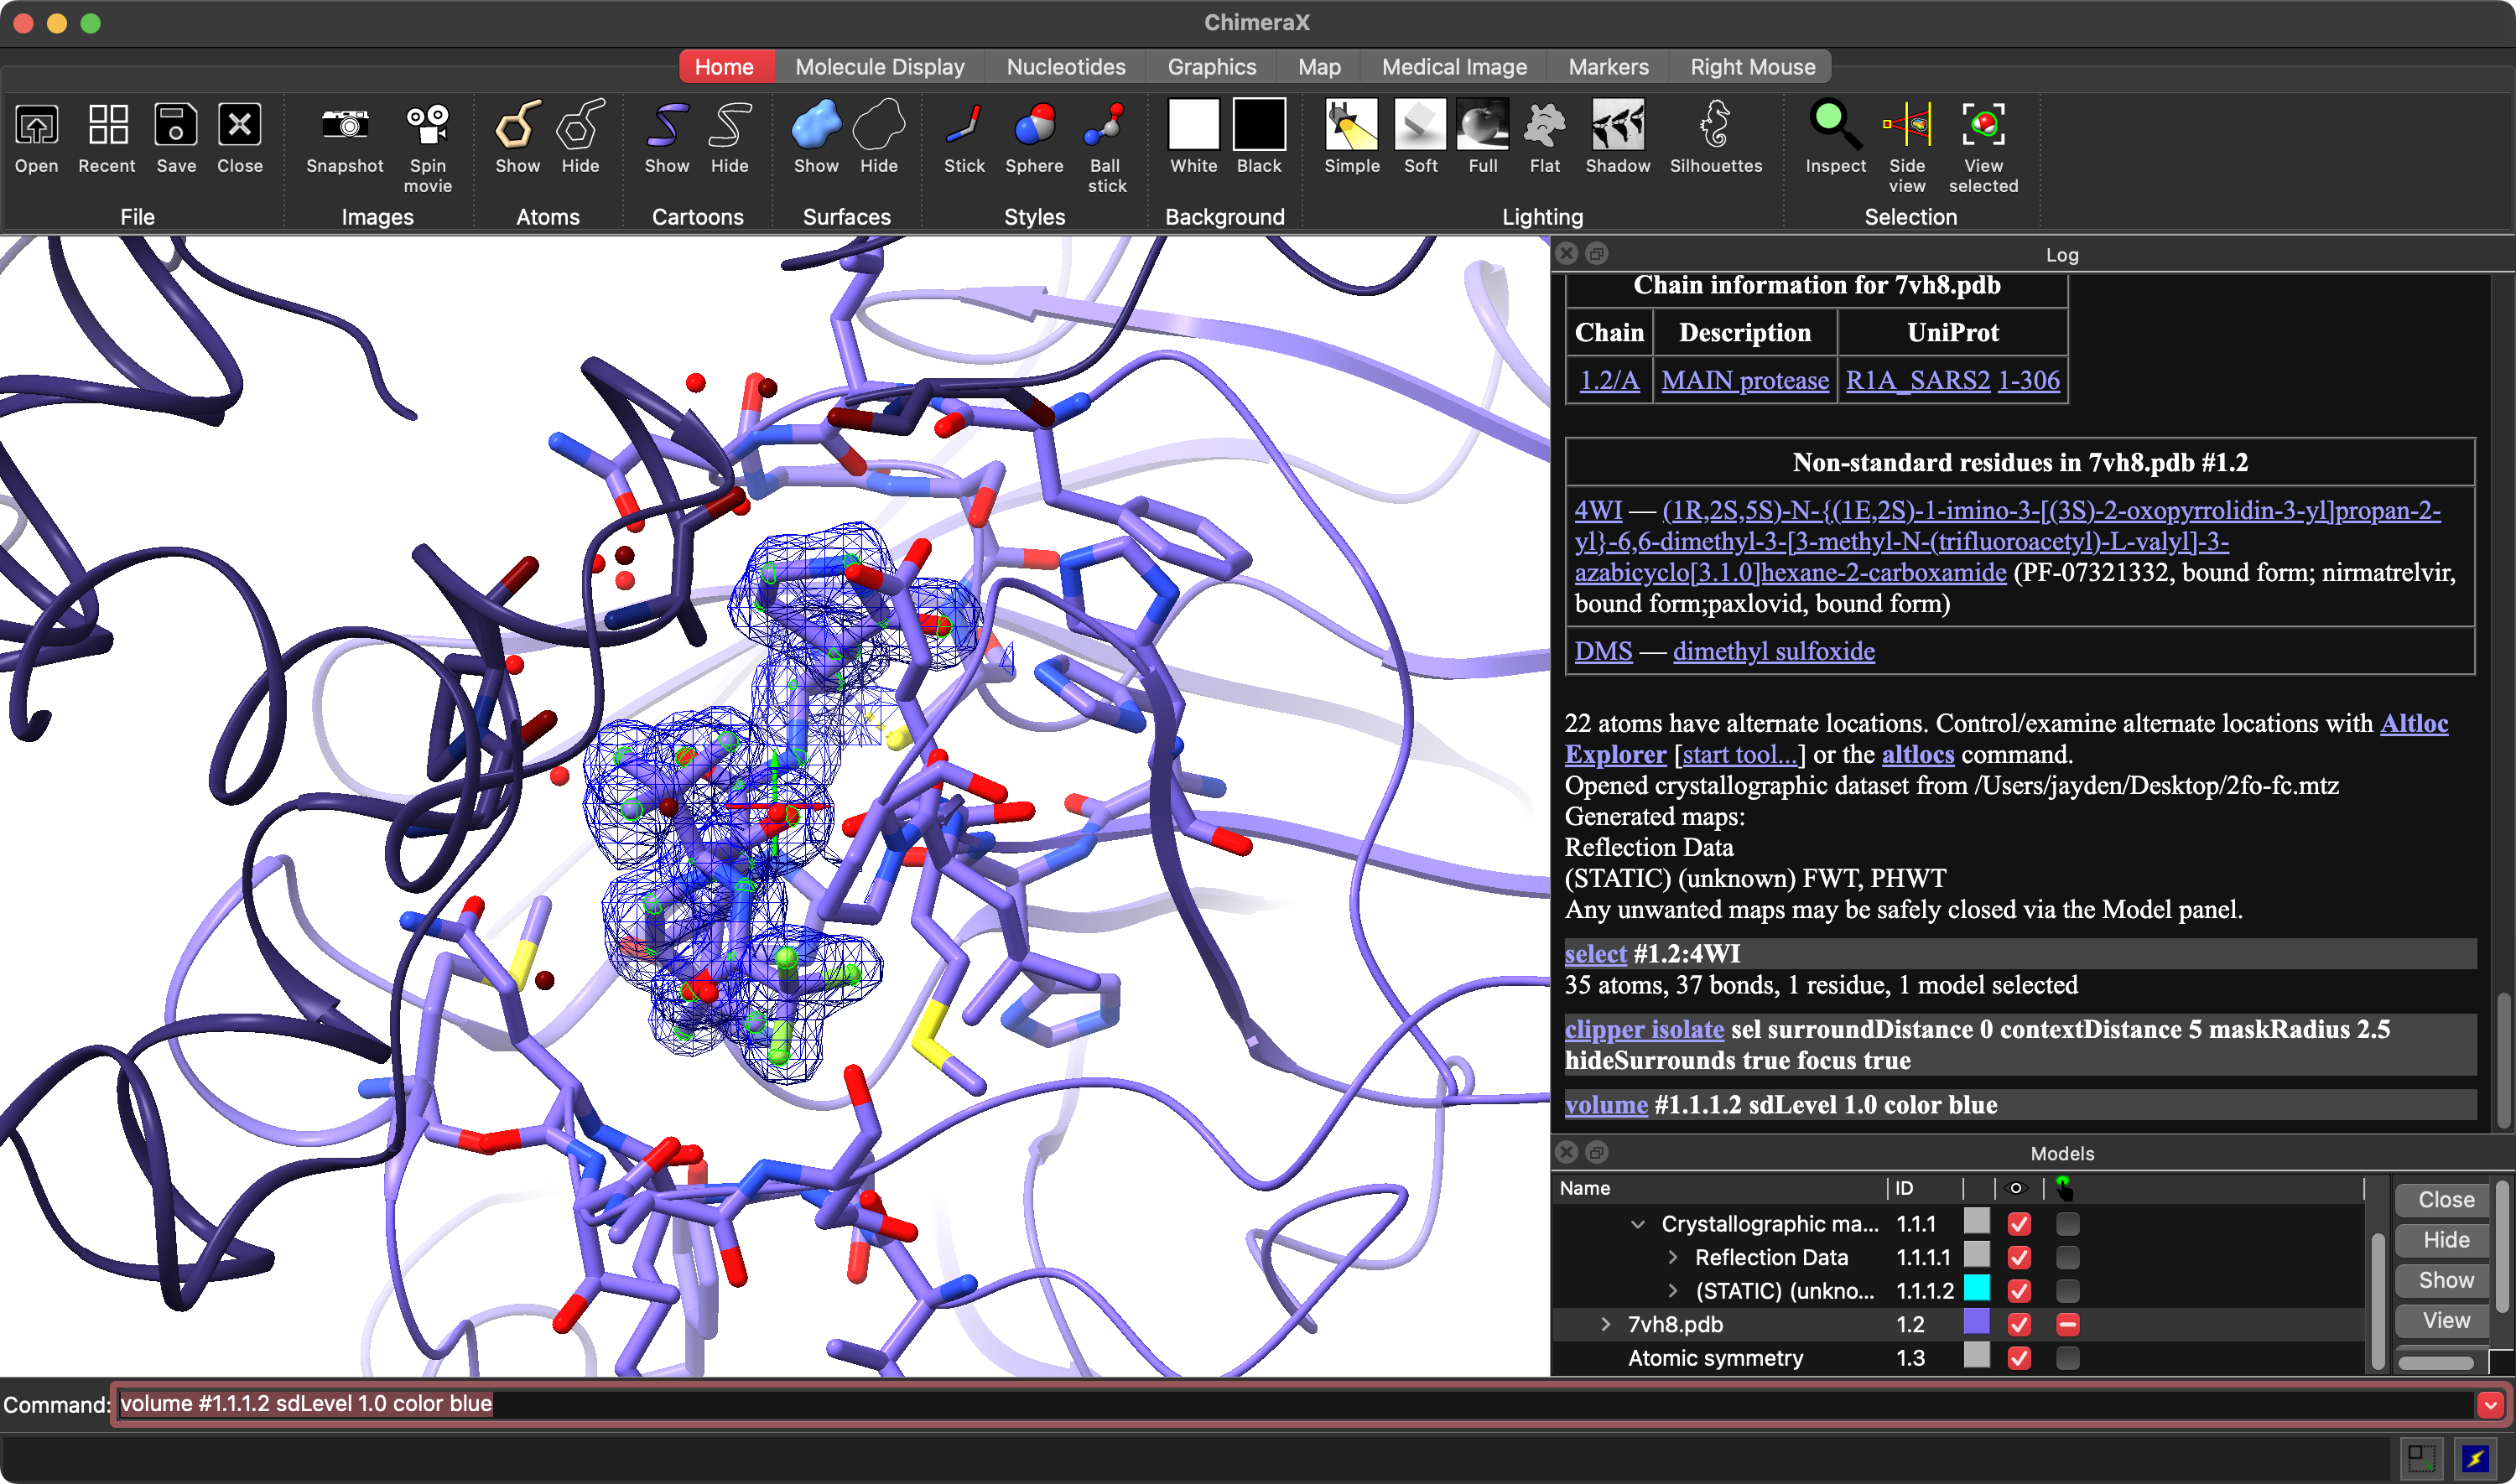
CHIMERAX
volume #1.1.1.2 sdLevel 1.0 color blue
Contour Level
Here you can use color blue to assign the color.
For an mFo-Fc difference map, you may want to set positive and negative levels:
CHIMERAX
volume #1.1.1.4 sdLevel 3.0 color green sdLevel -3.0 color red
[!TIP]
If there's an axis indicator at the center in ChimeraX, you can turn it off with cofr show false.
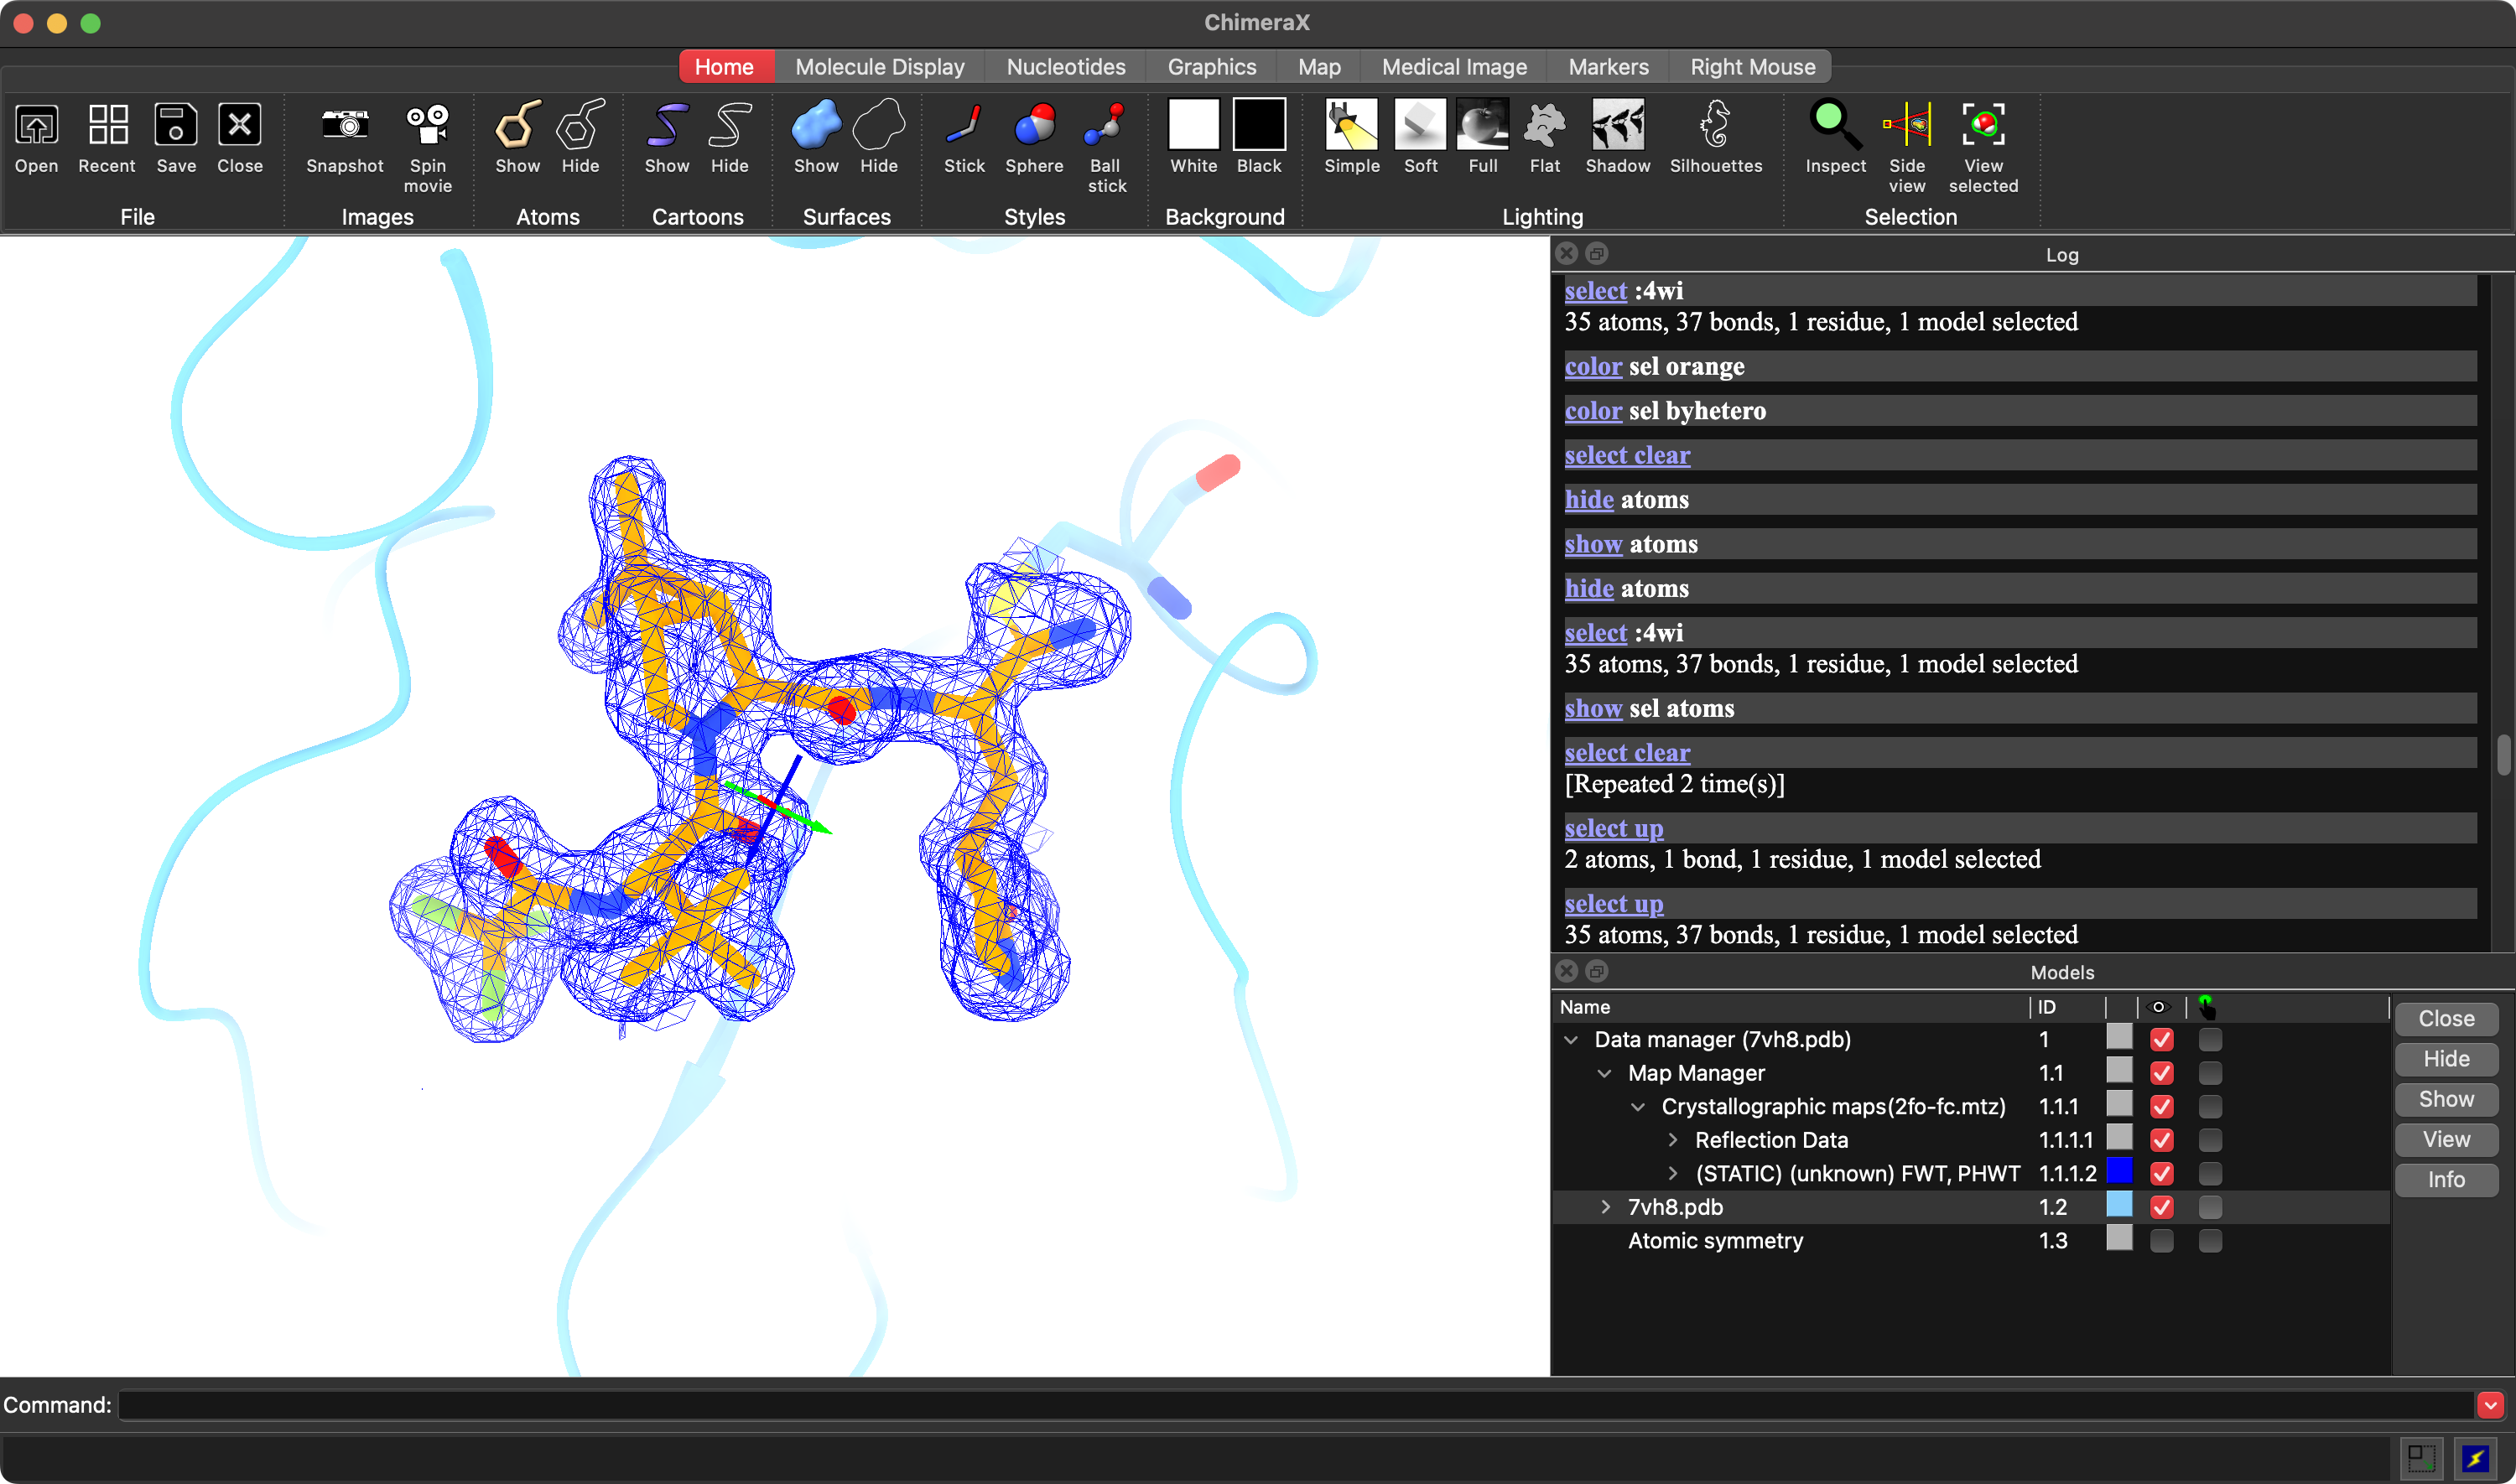
After a few simple adjustments to lighting and color, you'll have a beautiful figure.
Final figure
Outro
There are many online tutorials on displaying and coloring cryo-EM density, but there seem to be fewer on crystal structures. I hope this helps.